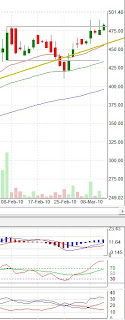
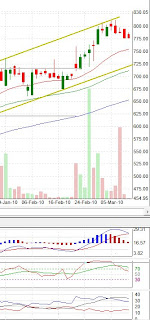
Both IndusIndustrial Bank and Sun Pharma have had a good run up.
Sun Pharma has developed an engulfing bearish pattern and can move downwards from here.
Tuesday, March 30, 2010
Monday, March 29, 2010
Areva T&D can touch 340
Areva T&D has broken out of its long term trading range.
On the ADX charts it has moved to 24 - which shows a new trend in development. On the MACD charts it been showing lot of strength and an uptrend.
The target can be 340.
Sell Patni Computers
Patni Computers has had a good run up and is now looking weaks on the charts. Today is the 2nd consequitive day the stock has fallen.
I recommend selling the stock and booking profits.
I recommend selling the stock and booking profits.
Friday, March 26, 2010
Buy Union bank of India
Union Bank of India is moving up, its on its 52-week high.
The ADX has crossed 20 and a trend is developing, the MACD is also showing strength.
On the price charts the share has been moving up constantly from past 6 days.
The ADX has crossed 20 and a trend is developing, the MACD is also showing strength.
On the price charts the share has been moving up constantly from past 6 days.
Thursday, March 25, 2010
LUPIN can move further up
Lupin is on its upward march since 22-Feb, currently it is at its 52-week high levels. On the ADX charts its at 19, just approaching the 20 mark.
If it successfully crosses the 20 mark with +DI remaining higher than the -DI then a giger upmove is possible.
The MACD charts are also showing shtrength of an uptrend.
If it successfully crosses the 20 mark with +DI remaining higher than the -DI then a giger upmove is possible.
The MACD charts are also showing shtrength of an uptrend.
Cipla can touch 363
Cipla is developing a new trend as the ADX is touched 23 with DI+ higher than the DI-.
The MACD charts show strength and the trend movement is upwards.
Cipla is likely to touch 363.
The MACD charts show strength and the trend movement is upwards.
Cipla is likely to touch 363.
Alerts for sell ...
ACC, Piramal Healthcare, Godrej Consumer products, Novartis India an Axis Bank- all can be sold. Weakness is seen on the stocks and further downward movement is possible.
Tuesday, March 16, 2010
Buy IndusIndustrial Bank for target of 170 and 180
IndusIndustrial Bank is on a long term uptrend. Its been rising stedily upwards with the trend-line. Both short-term and long term investors can make entries in it.
On the ADX charts the ADX hasmoved above 20 to 25.
The MACD line has also crossed over the MACD signal line.
Disclosure: I hold the stock in my portfolio.
On the ADX charts the ADX hasmoved above 20 to 25.
The MACD line has also crossed over the MACD signal line.
Disclosure: I hold the stock in my portfolio.
Buy IPCA Labs
IPCA labs has broken out of its long trading range.
The MACD signal line has also moved above the MACD line which confirms an uptrend.
Disclosure: I hold the stock in my portfolio.
The MACD signal line has also moved above the MACD line which confirms an uptrend.
Disclosure: I hold the stock in my portfolio.
Gujrat Gas is a buy!
Gujrat Gas is breaking out of its long term trading range.
On the ADX charts its managed to move to 21 - which shows a start of the trend.
On the MACD charts - the movement looks upwards as the MACD line has crossed over the MACD signal line.
Disclosure: I hold it in my portfolio.
On the ADX charts its managed to move to 21 - which shows a start of the trend.
On the MACD charts - the movement looks upwards as the MACD line has crossed over the MACD signal line.
Disclosure: I hold it in my portfolio.
Berger Paint can touch 61 and then 64.
Berger Paints can touch 61 in the short term and if that holds then 64 can se seen.
On the ADX charts the +DI has made a cross-over the -DI and on the MACD charst the MACD line has crossed over the MACD signal line. These positive signals show an upmove.
On the ADX charts the +DI has made a cross-over the -DI and on the MACD charst the MACD line has crossed over the MACD signal line. These positive signals show an upmove.
Sunday, March 14, 2010
Book profits in Amtek India .
Amtek India is looking weak on the charts and it is a sell candidate.
On the ADX charts its turned around from the 38 level to 36 - which shows weakness in the trend.
On the MACD charts the MACD signal line has moved over the MACD line and shows weakness.
On the ADX charts its turned around from the 38 level to 36 - which shows weakness in the trend.
On the MACD charts the MACD signal line has moved over the MACD line and shows weakness.
Havells India can be bought for targets of 575 and 600.
Havells India is developing a new trend, the ADX is at 22.85. On the MACD charts the MACD line has crossed MACD signal line - which shows the trend upwards.
The immidiate targets could be 575 and if thats crossed then 600.
Disclosure: I hold it in my portfolio.
The immidiate targets could be 575 and if thats crossed then 600.
Disclosure: I hold it in my portfolio.
Thursday, March 11, 2010
Traders can buy Torrent Pharma
A new trend is developing in Torrent Pharma. The ADX has moved above the 20 mark to 24. The trend is up which can be confirmed by the MACD charts - where the MACD line has crossed over the MACD signal line to move upwards.
Disclosure: I hold it in my portfolio.
Disclosure: I hold it in my portfolio.
Tata Motors can se sold.
Tata Motors look weak and can be sold.
The ADX line on the ADX charts is moving downwards which shows the end of the current trend.
On the MACD charts weaakness is seen and it showing a downward movement.
The ADX line on the ADX charts is moving downwards which shows the end of the current trend.
On the MACD charts weaakness is seen and it showing a downward movement.
HCL Tech looks weak and can be sold by traders
HCL Technologies is trading with very low volumes. On the MACD charts the MACDline has crossed over the MACD signal line and is moving downwards.
On the ADX charts the DI- line is above the DI+ line and the ADX line is moving upwards towards the 20 mark which shows that the new downtrend is in the begining.,
On the ADX charts the DI- line is above the DI+ line and the ADX line is moving upwards towards the 20 mark which shows that the new downtrend is in the begining.,
Traders can sell Cadila Healthcare
Cadila Healthcare has started looking weak on the charts. A slight correction is seen from these levels. Traders can exit heir long positions.
On the ADX charts it has peaked out at 35 and now turned around downwards..
On the MACD charts, the MACD line is just about to cross-over the MACD signal line and move downwards.
On the ADX charts it has peaked out at 35 and now turned around downwards..
On the MACD charts, the MACD line is just about to cross-over the MACD signal line and move downwards.
Tuesday, March 9, 2010
Patni Computers marching upwards.... can touch 526
Patni computers can touch 526. The trend has already started few days back. The ADX is at 24.5 - which shows a strong trend in making.
The trend is up as seen in the MACD charts and the trend line.
Disclosure: I hold it on my portfolio.
The trend is up as seen in the MACD charts and the trend line.
Disclosure: I hold it on my portfolio.
Novartis can touch 550 and 568.
Novartis India after a long sideways movement is ready for an upmove.
On the ADX charts the ADX line is at 19.23, approaching towards 20 - which depicts a start of a trend. The trend is upwards as seen on the MACD charts.
Novartis can touch 550 and then 568.
Disclosure: I hold it in my portfolio.
On the ADX charts the ADX line is at 19.23, approaching towards 20 - which depicts a start of a trend. The trend is upwards as seen on the MACD charts.
Novartis can touch 550 and then 568.
Disclosure: I hold it in my portfolio.
Sunday, March 7, 2010
Shiv-vani Oil is on the move...
Shiv-vani Oil is constantly moving upwards. It can be bought at these levels of 370.
On the ADX charts after showing an initial dip to 23 it has moved back to 28 - which shows that the trend is strong.
On the MACD charts the MACD signal line has crossed over the MACD line - which shows the start of the uptrend.
On the ADX charts after showing an initial dip to 23 it has moved back to 28 - which shows that the trend is strong.
On the MACD charts the MACD signal line has crossed over the MACD line - which shows the start of the uptrend.
Friday, March 5, 2010
GIC Housing Finance can touch 95
GIC housing Finace has immidiate tarhet of 95 and moving up further it can touch 100.
On the ADX chart it has just touched 20 and the +DI is much higher than the -DI. A new trend is in the making.
On the MACD charts its showing upward movement from the last 4 days; with slight increments in volumes as well.
Disclosure: I hold it in my portfolio.
On the ADX chart it has just touched 20 and the +DI is much higher than the -DI. A new trend is in the making.
On the MACD charts its showing upward movement from the last 4 days; with slight increments in volumes as well.
Disclosure: I hold it in my portfolio.
Buy UCO Bank
UCO bank can be bought at these levels. It has broken the triangle on the upside with increasing volumes.
Also the MACD signal line has crossed over the MACD line - which shows strength on the charts.
Immidiate upside target could be 64.
Disclosure: I hold it in my portfolio.
Also the MACD signal line has crossed over the MACD line - which shows strength on the charts.
Immidiate upside target could be 64.
Disclosure: I hold it in my portfolio.
Buy Dena Bank
All stock under the Banking sector are showing strength.
Dena Bank has moved up smartly. The ADX indicator has just moved above 20 which shows begining of a new trend.
The MACD indicator is also progressing up daily.
Dena Bank has moved up smartly. The ADX indicator has just moved above 20 which shows begining of a new trend.
The MACD indicator is also progressing up daily.
Thursday, March 4, 2010
ACC is a buy
A new trnd is developing in ACC as shown by the ADX chart. The ADX indicator is just passed above the 20 mark, with +DI at 28, and -DI at 14.
The up-trend is confirmed by the MACD which is rising continously.
Disclosure: I hold this stock in my portfolio.
The up-trend is confirmed by the MACD which is rising continously.
Disclosure: I hold this stock in my portfolio.
Subscribe to:
Comments (Atom)


